Is RS the same as RSI?
No. RS compares a stock with the market or an index. RSI is an oscillator based only on the stock's own recent gains and losses.
Swing trading glossary
Relative strength (RS) is how a stock performs compared with the market or its index. It is a comparison, not the same as RSI.
Relative strength compares a stock's price performance with the broad market, such as the Nifty. If the market is up 5% over a period and a stock is up 25%, that stock has strong relative strength. If the market falls and the stock holds steady, that also shows strength.
Swing traders use RS to find leaders. Stocks that hold up well when the market dips, and push ahead when it rises, often become the big movers when conditions improve. A simple way to see it is the RS line: the stock's price divided by the index. A rising RS line means the stock is outperforming.
Some tools also turn relative strength into a rating, ranking each stock's performance against all others over a period. A high rating means the stock has done better than most of the market.
Relative strength is not RSI. RSI only looks at a stock's own recent gains and losses, while RS compares it with the market. A stock can have high RS and a moderate RSI at the same time. Checking RS during market dips is especially useful, because the stocks that hold up best often lead the next rally.
Over three months the Nifty rises 4%. Stock A rises 22% and Stock B rises 2%. Stock A has strong relative strength; Stock B is lagging the market even though it is slightly up.
No. RS compares a stock with the market or an index. RSI is an oscillator based only on the stock's own recent gains and losses.
It is the stock's price divided by an index, plotted as a line. When it makes new highs, the stock is outperforming the market more than at any point in that period.
Related terms
N.E.X.T reads the market, ranks 65+ industries and runs focused momentum scans across 2,100+ NSE stocks every day.
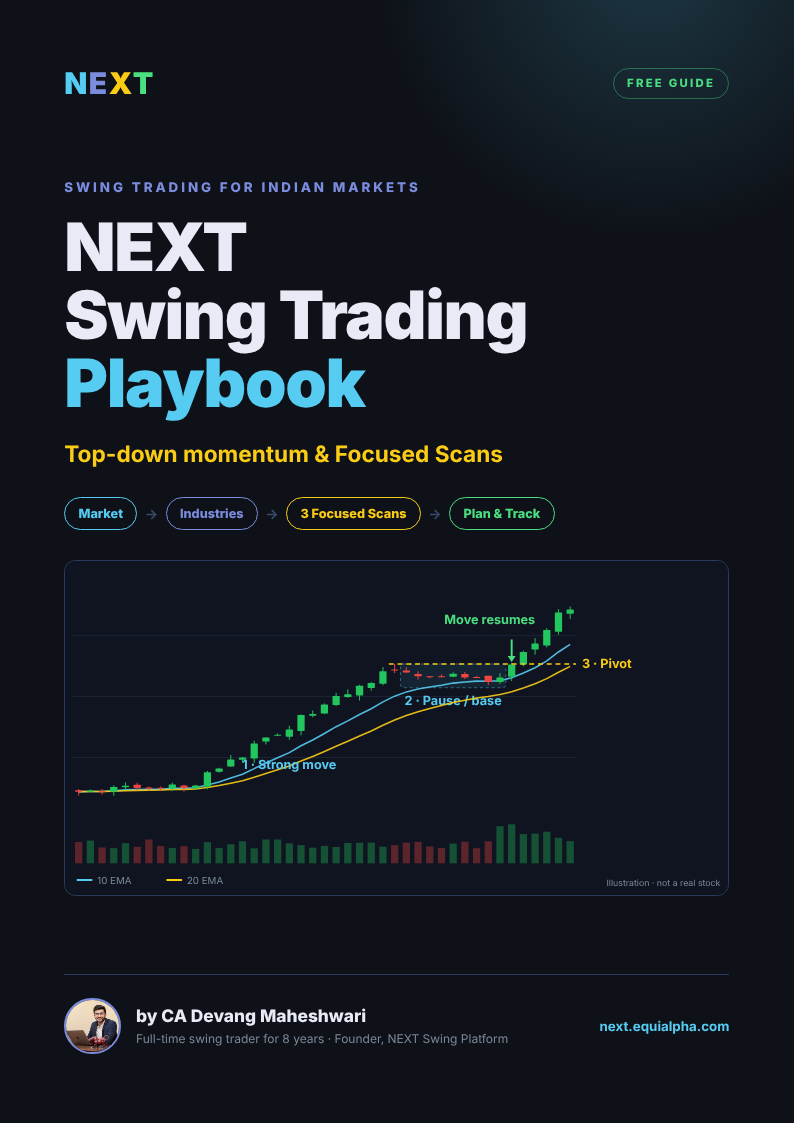
Get every guide in one PDF
The free NEXT Swing Trading Playbook — 11 chapters, charts and printable checklists.

Written by CA Devang Maheshwari — full-time swing trader for 8 years, founder of Equialpha and builder of N.E.X.T, the swing trading platform for Indian markets. About Devang