What is a good RSI for swing trading?
There is no single good number. In momentum trading, a strong stock often keeps RSI in the upper part of the range; RSI works best as a supporting check alongside price structure.
Swing trading glossary
RSI (Relative Strength Index) is an oscillator from 0 to 100 that compares a stock's own recent gains with its recent losses.
The Relative Strength Index, or RSI, measures the speed of a stock's recent price changes. It compares average gains with average losses over a set period, commonly 14 days, and shows the result on a scale from 0 to 100.
Readings near the top of the scale mean recent gains have been strong compared with losses. Readings near the bottom mean the opposite. Many traders call high readings overbought and low readings oversold, but in strong uptrends RSI can stay high for a long time while price keeps rising.
For momentum swing traders, a high RSI is often a sign of strength, not a reason to sell. Selling a leader just because RSI looks high can mean exiting early. RSI is more useful as a secondary check than as a main decision tool.
RSI is often confused with relative strength (RS). The names sound alike, but RSI only looks at the stock itself. RS compares the stock with the market. If you use RSI, keep it in the background. Price structure, the trend of the averages and relative strength against the market usually tell a swing trader more about whether a stock is worth watching.
A stock rises from ₹200 to ₹260 over a month with only small pullbacks. Its 14-day RSI reads in the high 70s. The stock is moving strongly; the high reading alone doesn't mean the move must end.
There is no single good number. In momentum trading, a strong stock often keeps RSI in the upper part of the range; RSI works best as a supporting check alongside price structure.
No. RSI measures a stock's own recent gains versus losses. Relative strength compares the stock's performance with the market.
Related terms
N.E.X.T reads the market, ranks 65+ industries and runs focused momentum scans across 2,100+ NSE stocks every day.
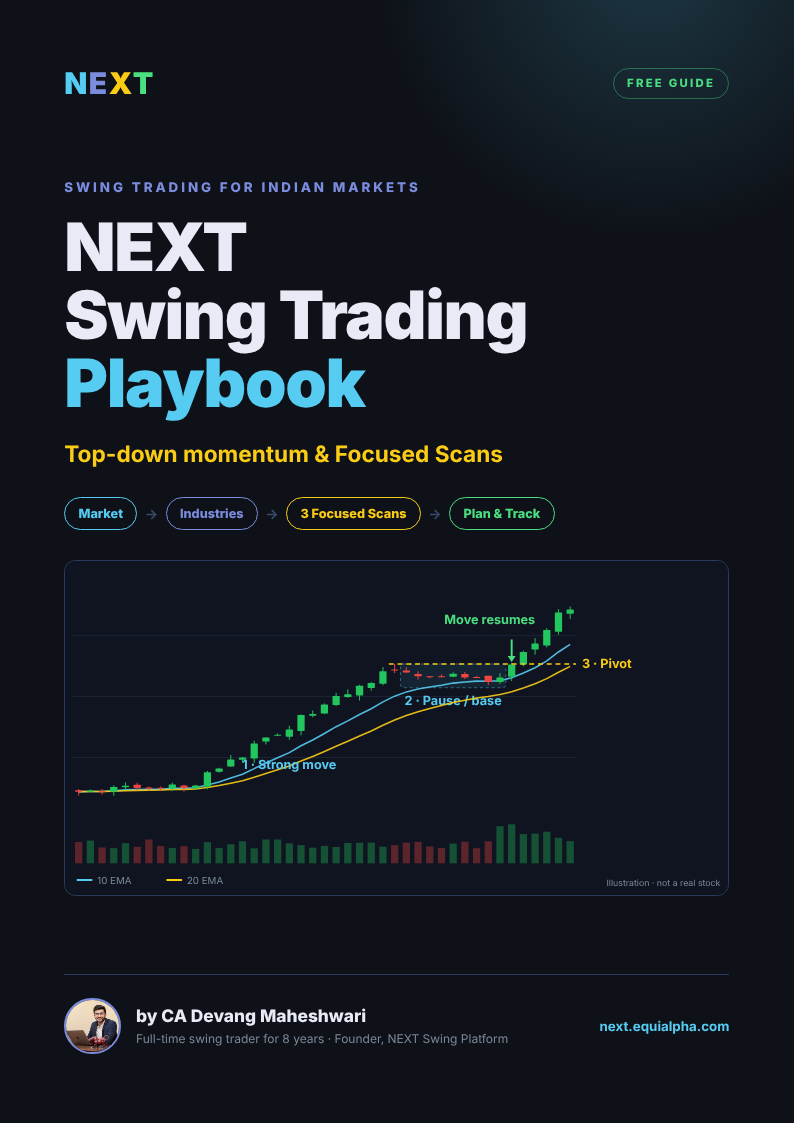
Get every guide in one PDF
The free NEXT Swing Trading Playbook — 11 chapters, charts and printable checklists.

Written by CA Devang Maheshwari — full-time swing trader for 8 years, founder of Equialpha and builder of N.E.X.T, the swing trading platform for Indian markets. About Devang