Which timeframe is best for swing trading?
The daily chart. Use the weekly to confirm the bigger trend and major levels, and the hourly only if you want to fine-tune an entry.
Start here
Swing traders hold for days to weeks, so the chart should match: daily candles for decisions, the weekly for the bigger picture, and lower timeframes only when you need them.
By CA Devang Maheshwari · Updated 2 November 2026
For swing trading, the daily chart is the main timeframe — setups, pivots, stops and EMAs are all read on daily candles. Use the weekly chart to confirm the bigger trend and spot major resistance. Hourly charts are optional, mainly for timing an entry. The best time to review is after the 3:30 PM close, when the day's candle is complete.
Big picture: trend and major levels
Decisions: setup, pivot, stop
Fine-tuning an entry
A swing trade lasts days to weeks. Each daily candle summarises a full session, which filters out the noise of minute-by-minute moves. Bases, pivots, the 10 and 20 EMAs and volume patterns are all clearest on daily candles.
Trend structure on daily candles
Key idea
If your holding period is days to weeks, your decisions should come from a chart where each candle is a day.
| Timeframe | Use it for | Don't use it for |
|---|---|---|
| Weekly | Confirming the long trend, Stage 2, major resistance and multi-month bases | Exact entries and stops |
| Daily | Setups, pivots, stops, EMAs, volume — every trade decision | — |
| Hourly | Optional: timing an entry near the pivot | Changing the plan made on the daily chart |
| 5–15 min | Mostly intraday trading | Swing trading decisions |
Watch out
Watching 5-minute charts during a swing trade usually leads to exiting good trades on normal noise. Let the daily plan do its job.
This is why swing trading fits people with full-time jobs. See the swing trading basics for a full routine.
The daily chart. Use the weekly to confirm the bigger trend and major levels, and the hourly only if you want to fine-tune an entry.
Hourly charts can help time an entry, but swing trading decisions — setup, pivot, stop — are best made on daily candles.
Yes, briefly. It shows whether the stock is in a long-term uptrend and where major resistance sits.
After the 3:30 PM IST close, when the daily candle is complete. Many traders review in the evening and place orders the next day.
N.E.X.T is built around the daily candle: end-of-day scans, market direction and industry ratings for a short evening review.
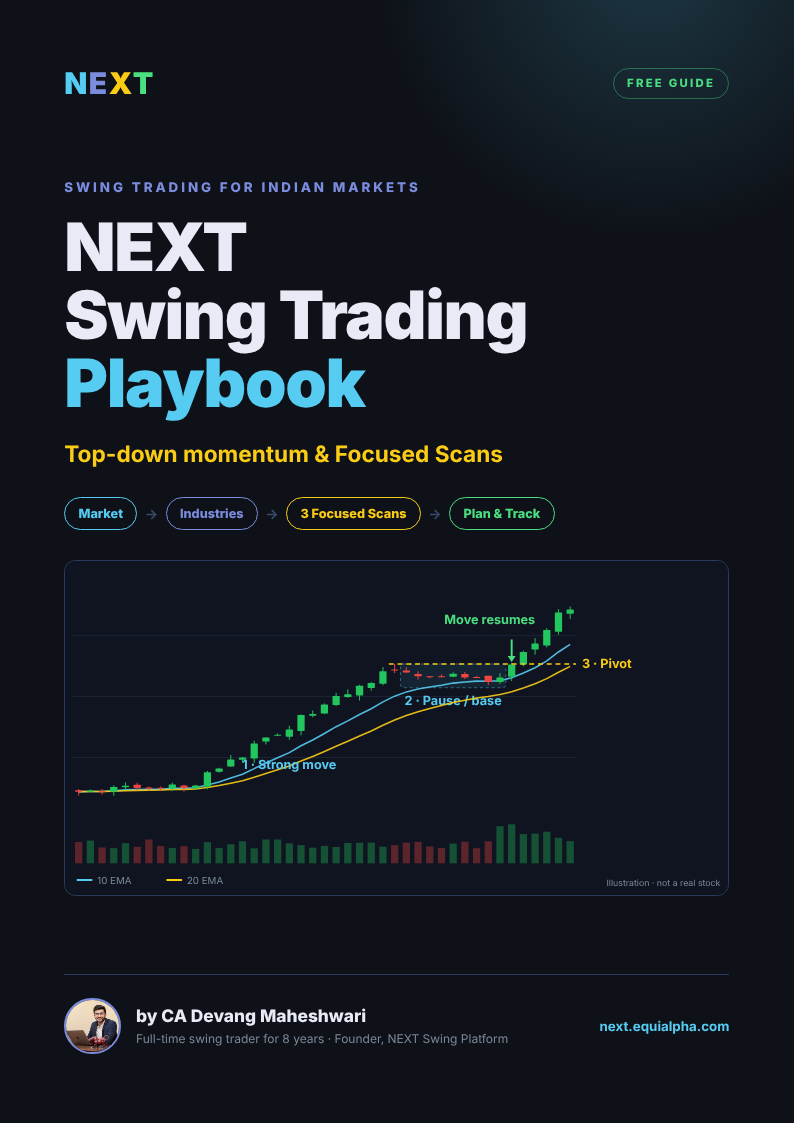
Get every guide in one PDF
The free NEXT Swing Trading Playbook — 11 chapters, charts and printable checklists.

Written by CA Devang Maheshwari — full-time swing trader for 8 years, founder of Equialpha and builder of N.E.X.T, the swing trading platform for Indian markets. About Devang