What is the difference between EMA and SMA?
An SMA weights every day in the period equally. An EMA gives more weight to recent days, so it turns faster when price changes direction.
Swing trading glossary
An EMA (exponential moving average) is an average of closing prices that gives more weight to recent days than older ones.
A moving average smooths out daily ups and downs so you can see the direction of the trend. An exponential moving average, or EMA, gives more weight to the most recent closes, so it reacts faster to new price action than a simple average.
Swing traders on daily charts commonly use a few EMAs. The 10 EMA tracks the short-term pace of a strong move. The 20 EMA shows the near-term trend and is a common support area during pullbacks. Longer ones, like the 50 EMA or the 200-day average, show the bigger trend.
EMAs are used in two simple ways. First, as a trend check: a stock above rising 10, 20 and 50 EMAs is in an uptrend. Second, as reference levels: how a stock behaves when it pulls back to its 10 or 20 EMA tells you a lot about its strength.
EMAs lag price, because they are averages. They don't predict anything. Treat them as a way to read structure and trend, not as automatic buy or sell lines. Keep the set small and consistent. Using the same two or three averages on every chart trains your eye, so you quickly notice when a stock is stronger or weaker than usual.
A stock closes at ₹520. Its 10 EMA is ₹510, its 20 EMA is ₹498 and its 50 EMA is ₹470, all rising. Price above rising averages stacked in that order points to an uptrend.
An SMA weights every day in the period equally. An EMA gives more weight to recent days, so it turns faster when price changes direction.
There is no single best one. Many swing traders use the 10 and 20 EMA for the short-term trend and the 50 EMA or 200-day average for the bigger picture.
Related terms
N.E.X.T reads the market, ranks 65+ industries and runs focused momentum scans across 2,100+ NSE stocks every day.
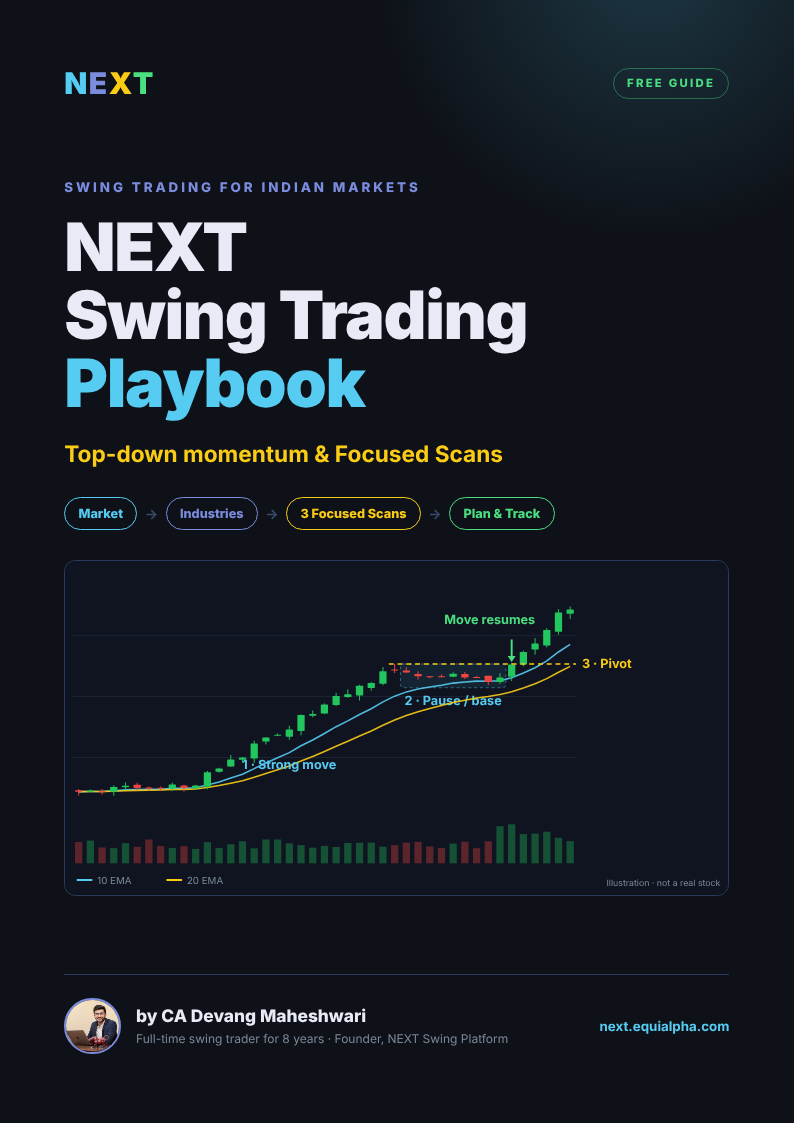
Get every guide in one PDF
The free NEXT Swing Trading Playbook — 11 chapters, charts and printable checklists.

Written by CA Devang Maheshwari — full-time swing trader for 8 years, founder of Equialpha and builder of N.E.X.T, the swing trading platform for Indian markets. About Devang