What does the 50 EMA tell you?
The intermediate trend. A rising 50 EMA with price above it suggests a healthy medium-term uptrend.
Swing trading glossary
The 50 EMA averages roughly ten weeks of closes and is used to judge the intermediate trend of a stock or index.
The 50 EMA is a medium-term moving average covering about ten weeks of trading. It moves more slowly than the 10 and 20 EMA, so it shows the intermediate trend rather than short-term swings.
In a stock that is in Stage 2, the 50 EMA slopes up and price stays above it most of the time, with the shorter averages above it as well. A stock trading below a falling 50 EMA is usually not a candidate for swing buying, because the bigger trend is working against you.
Deeper pullbacks in strong stocks sometimes find support near the 50 EMA. Positional traders often use a close below the 50 EMA as a sign that the larger trend has weakened and use it to manage exits.
Market breadth readings often use the 50 EMA too. The share of stocks trading above their 50 EMA gives a sense of how broad the participation in a rally is. For a quick check, see whether the 10, 20 and 50 EMA are stacked in that order with price above all three, which is typical of a healthy uptrend.
A stock has been in an uptrend for six months. Its 50 EMA has risen from ₹400 to ₹520. After a correction it dips to ₹525 and holds there, staying above the 50 EMA, so the intermediate trend is still intact.
The intermediate trend. A rising 50 EMA with price above it suggests a healthy medium-term uptrend.
Not exactly. The 50 DMA usually refers to a simple average, while the 50 EMA weights recent days more and reacts a little faster.
Related terms
N.E.X.T reads the market, ranks 65+ industries and runs focused momentum scans across 2,100+ NSE stocks every day.
Get every guide in one PDF
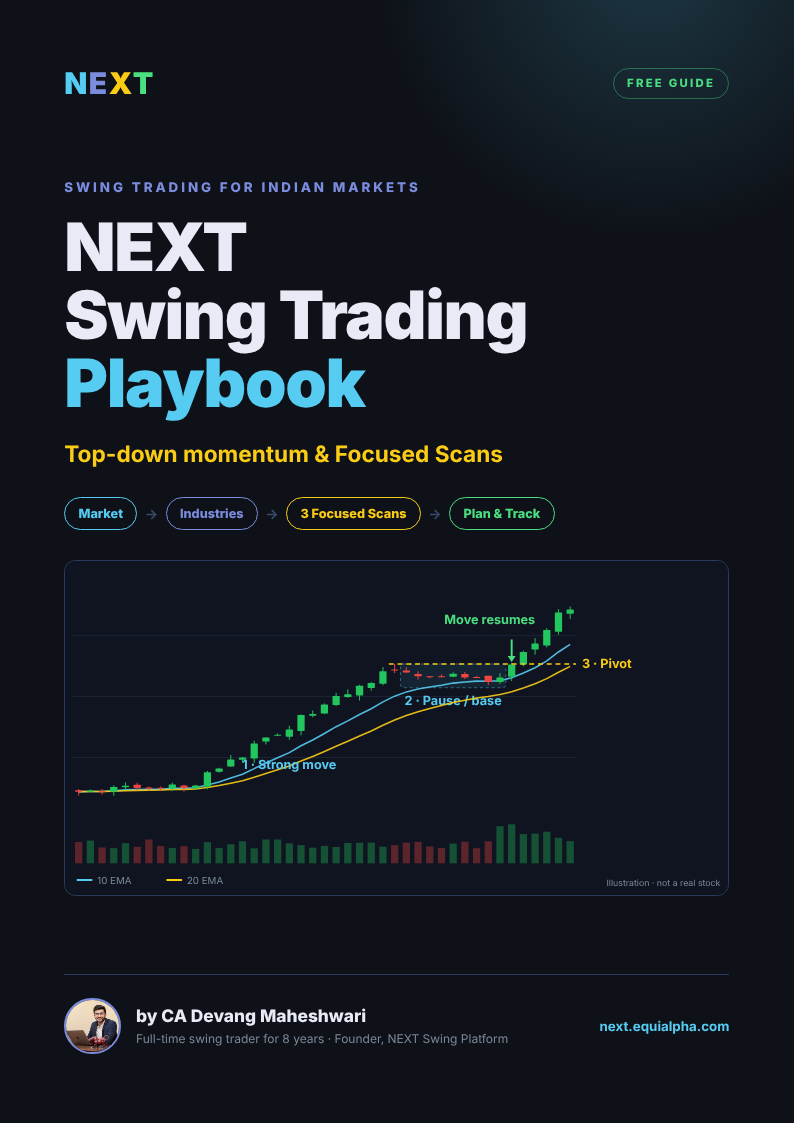
The free NEXT Swing Trading Playbook — 11 chapters, charts and printable checklists.

Written by CA Devang Maheshwari — full-time swing trader for 8 years, founder of Equialpha and builder of N.E.X.T, the swing trading platform for Indian markets. About Devang