What does it mean when a stock is above its 200 DMA?
It is generally in a long-term uptrend. For swing trading it is a useful filter, but not a reason to buy on its own.
Swing trading glossary
The 200 DMA is the average of the last 200 daily closes, widely used to separate long-term uptrends from downtrends.
The 200-day moving average (DMA) covers roughly ten months of trading. It is one of the most widely watched lines on any chart because it shows the long-term trend clearly and changes direction slowly.
A stock above a rising 200 DMA is generally in a long-term uptrend; one below a falling 200 DMA is in a long-term downtrend. For swing traders, the 200 DMA is mostly a filter. Strong swing candidates are usually well above it, with the shorter averages stacked above it too.
Because so many market participants watch it, the 200 DMA often acts as a major support or resistance zone. A stock reclaiming its 200 DMA after a long decline is improving, but it usually needs time to build a base before it becomes a strong uptrend.
The share of stocks above their 200 DMA is also a common breadth measure, showing how healthy the broader market is. When most stocks are below their 200 DMA, even good-looking setups face a harder backdrop. Some traders use the 200 EMA instead of the simple 200 DMA; the idea is the same, the line just reacts slightly faster.
A stock fell from ₹900 to ₹500 over a year and sat below a falling 200 DMA near ₹700. Months later it climbs above a now-flattening 200 DMA at ₹620 and builds a base, an early sign of improvement rather than an immediate buy.
It is generally in a long-term uptrend. For swing trading it is a useful filter, but not a reason to buy on its own.
It shows the long-term trend clearly, and because it is widely followed, price often reacts around it.
Related terms
N.E.X.T reads the market, ranks 65+ industries and runs focused momentum scans across 2,100+ NSE stocks every day.
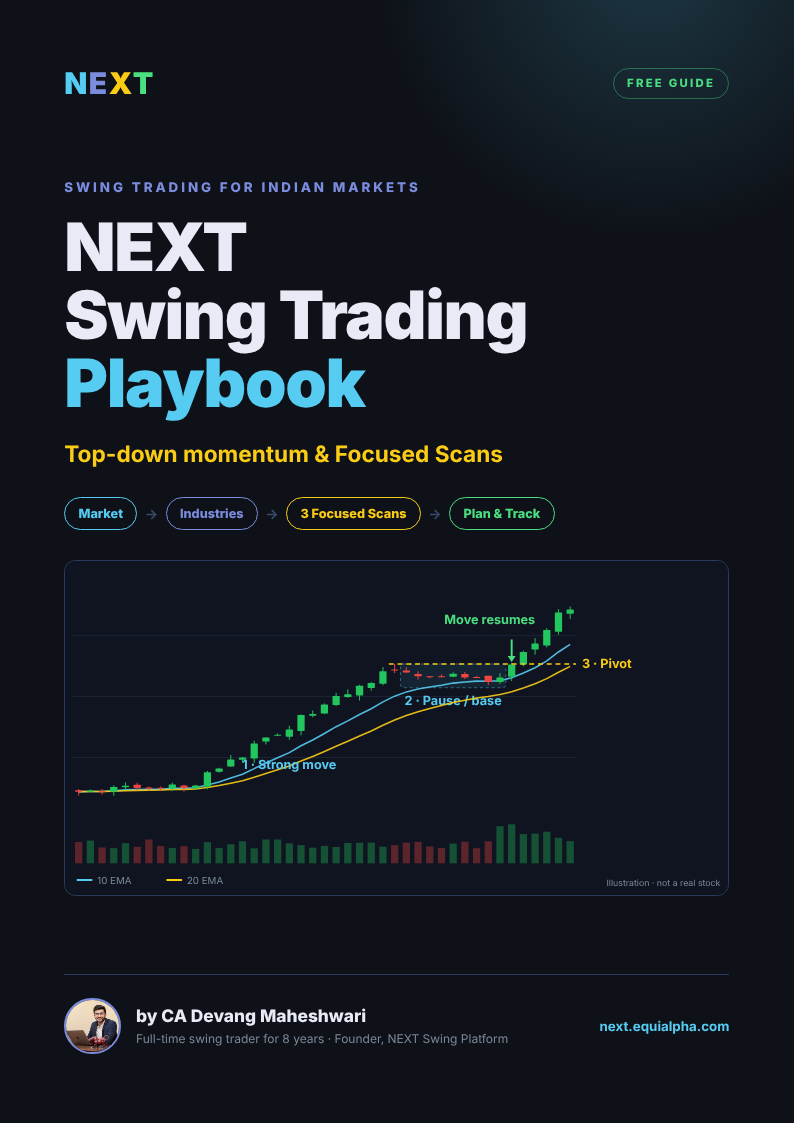
Get every guide in one PDF
The free NEXT Swing Trading Playbook — 11 chapters, charts and printable checklists.

Written by CA Devang Maheshwari — full-time swing trader for 8 years, founder of Equialpha and builder of N.E.X.T, the swing trading platform for Indian markets. About Devang