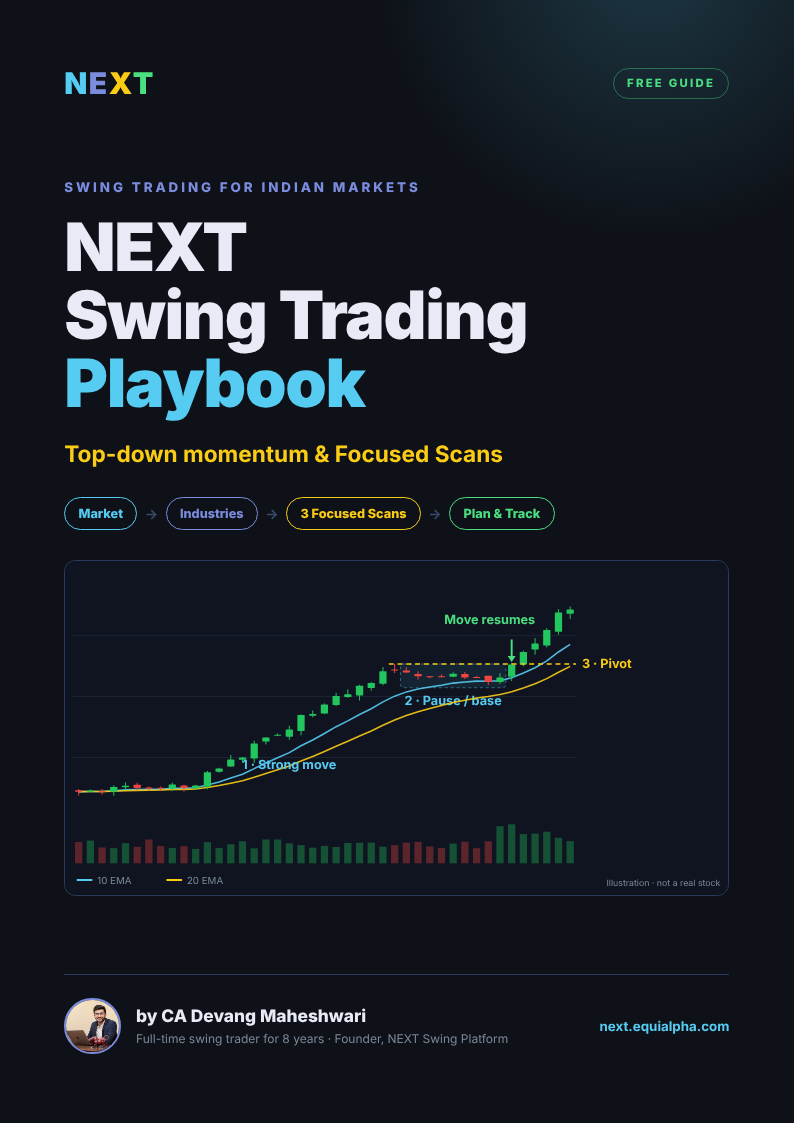
Momentum stocks are the ones buyers keep coming back to, week after week. Finding them isn't about scrolling the top gainers list. It's about a top-down process that filters 2,100+ NSE stocks down to a few worth studying.
To find momentum stocks in NSE, work top-down: check market direction, find industries with momentum, pick stocks with high relative strength, confirm an uptrend with aligned EMAs near highs, then wait for a base and pivot before adding to a watchlist. Momentum means sustained buying strength, not a one-day jump, so one big green candle is not enough.
The top-down momentum funnel
Each step removes stocks that don't fit.
Step 1
Market
Is the index in an uptrend?
↓
Step 2
Industries
Which groups have momentum?
↓
Step 3
Leaders
High relative strength, aligned EMAs, near highs
↓
Step 4
Base + pivot
A pause with a level to plan around
From 2,100+ liquid stocks to a short watchlist with a risk plan.
What is a momentum stock?
A momentum stock is one showing sustained buying strength: higher highs and higher lows, rising moving averages, and price holding near its highs while many other stocks struggle.
Sustained strength vs a one-day jump
Momentum is buying strength that shows up day after day. A single big candle that fades isn't momentum. · Illustration, not a real stock.
The key word is sustained. A stock that jumps sharply on a news headline and gives it all back the next week isn't a momentum stock. A stock that keeps climbing steadily for weeks, pausing and resuming, is.
Key idea
Momentum is a trend you can see over weeks, not a single candle. One strong day is not enough.
The step-by-step process
The trend structure to look for
Higher highs and higher lows, with price above rising, aligned 10, 20 and 50 EMAs. · Illustration, not a real stock.
Six steps, in this order
1. Market direction — Check the index. An uptrend means price is above rising 10 and 20 EMAs with the 10 above the 20. In a downtrend, be far more selective, or sit out.
2. Strong industries — Find industries where many stocks are moving together. Group strength gives individual stocks a tailwind.
3. Relative strength — Within those industries, pick stocks outperforming the market and their peers. See RS rating explained.
4. Trend structure — Confirm the chart: higher highs and higher lows, rising and aligned EMAs, and price trading near its highs.
5. Base and pivot — Wait for the stock to pause and form a base. The high of that base is the pivot, the level to plan around.
6. Watchlist and risk plan — Add it with the pivot, a stop level and a position size. It's a candidate to evaluate, not an automatic entry.
The order matters. Starting from stocks and working upward means you end up with charts that look great in a market that won't support them.
Why the market and industry come first
Most stocks move with the market, and stocks in the same industry often move together. A strong stock in a strong industry in a rising market has three forces behind it. The same chart in a falling market has one.
Check the market before the stock
The same stock behaves differently in an uptrend, a downtrend and an uncertain “uptrend try” phase. · Illustration, not a real stock.
In a weak market, the response isn't to stop thinking. It's to adjust: smaller size, fewer trades, faster profit booking, and close attention to whether breakouts actually follow through. For more on why groups lead, read why industry momentum leads stocks.
What to avoid
Avoid stocks already stretched far from their base
Extended stocks offer little room between entry and a sensible stop. · Illustration, not a real stock.
One-day spikes
A big move on news with no trend behind it often fades. Look for weeks of strength, not one candle.
Illiquid stocks
Thinly traded stocks move on a few orders and are hard to exit. Use a minimum average traded value as a filter.
Extended stocks
A stock far above its 10 and 20 EMAs with no base has the move behind it. Wait for a pause instead of chasing.
Top-gainer lists
Today's biggest gainers mix real leaders with noise. They're a starting point at best, not a process.
Watch out
A stock can show strong momentum and still fall. Momentum improves the odds of a structure; it never removes risk. Every idea needs a stop.
Manual process vs using a platform
You can do every step above by hand with free charts. It works, but it takes time, and on a busy day it's easy to skip the market and industry checks.
Manual process
Using a platform
Market direction
Check index EMAs yourself each day
Market direction shown upfront
Industry strength
Build and track your own groups
Industries rated and ranked
Relative strength
Compare charts one by one
RS included in a stock rating
Scanning
Write and maintain screener filters
Defined scans run on a schedule
Chart levels
Draw pivots and bases yourself
Pivot and reference levels drawn
Time needed
Hours a week
Much less; more time for review
Either way, the final decision is yours. A platform speeds up the filtering, not the judgment.
How N.E.X.T approaches it
N.E.X.T is a swing trading platform for Indian markets built on this exact top-down flow. It covers 2,100+ NSE stocks and 65+ industries, starting with market direction, then industry ratings through N.E.X.T Momentum and a Leading Industries view.
Stock ratings combine trend, industry strength, relative strength and scan activity. Three focused momentum scans (Follow Through Swing, 20 EMA Base and IPO Base) list current candidates, and the Chart Terminal draws the pivot and reference levels for your own review. N.E.X.T does not place orders or recommend stocks.
Frequently asked questions
How do I find momentum stocks in NSE?
Work top-down: check market direction, find strong industries, pick stocks with high relative strength and an uptrend with aligned EMAs near highs, then wait for a base and pivot. Add candidates to a watchlist with a stop and position size.
What is a momentum stock?
A momentum stock shows sustained buying strength: higher highs and higher lows, rising moving averages and price near its highs. A single big up day doesn't make a stock a momentum stock.
Which indicators help find momentum stocks?
Rising, aligned 10 and 20 EMAs help assess trend direction, and relative strength shows whether a stock is outperforming the market. Volume and liquidity checks help filter out noise.
Should I buy the top gainers of the day?
Not as a process. Top gainers mix real leaders with one-day news spikes. Look for weeks of strength and a base with a pivot instead.
Do momentum stocks work in a falling market?
Far less reliably. In a weak market, use smaller size, fewer trades and faster profit booking, and watch whether breakouts follow through.
How many stocks does N.E.X.T cover?
N.E.X.T covers 2,100+ NSE stocks across 65+ industries, applying liquidity checks before stocks reach the scans.
See the top-down process in action
Watch the N.E.X.T walkthrough to see market direction, industry momentum and the three momentum scans narrow 2,100+ stocks to a short list.
Written by CA Devang Maheshwari — full-time swing trader for 8 years, founder of Equialpha and builder of N.E.X.T, the swing trading platform for Indian markets. About Devang